
Indicators
Create indicators that evaluate controls automatically, apply them to controls, and read their evaluation logs.
About indicators
An indicator is an automated evaluation that determines whether a system, environment, or function matches machine-readable criteria you define.
You can apply an indicator to a control to track activity related to that control’s requirements. For example, a control that mandates a folder contains specific permissions can be monitored to evaluate and log any instances of unauthorized access.
In moving towards evaluating control requirements programmatically, teams transform error-prone, point-in-time audits into proactive, continuous monitoring.
Key concepts and actions associated with indicators include:
- Understanding indicator scope
- Understanding evaluation statuses
- Creating an indicator
- Applying an indicator to controls
- Activating and disabling indicators
- Sending events to an indicator
- Viewing indicator evaluation logs
- Additional evaluation guidance
Understanding indicator scope
Indicators are created at the project level. Once created, an indicator can be applied to any number of policies and controls in the project for which it was created.
Organization Owners and Project Owners can create and apply indicators. Indicators are always project-scoped, and cannot be distributed organization-wide.
Understanding evaluation statuses
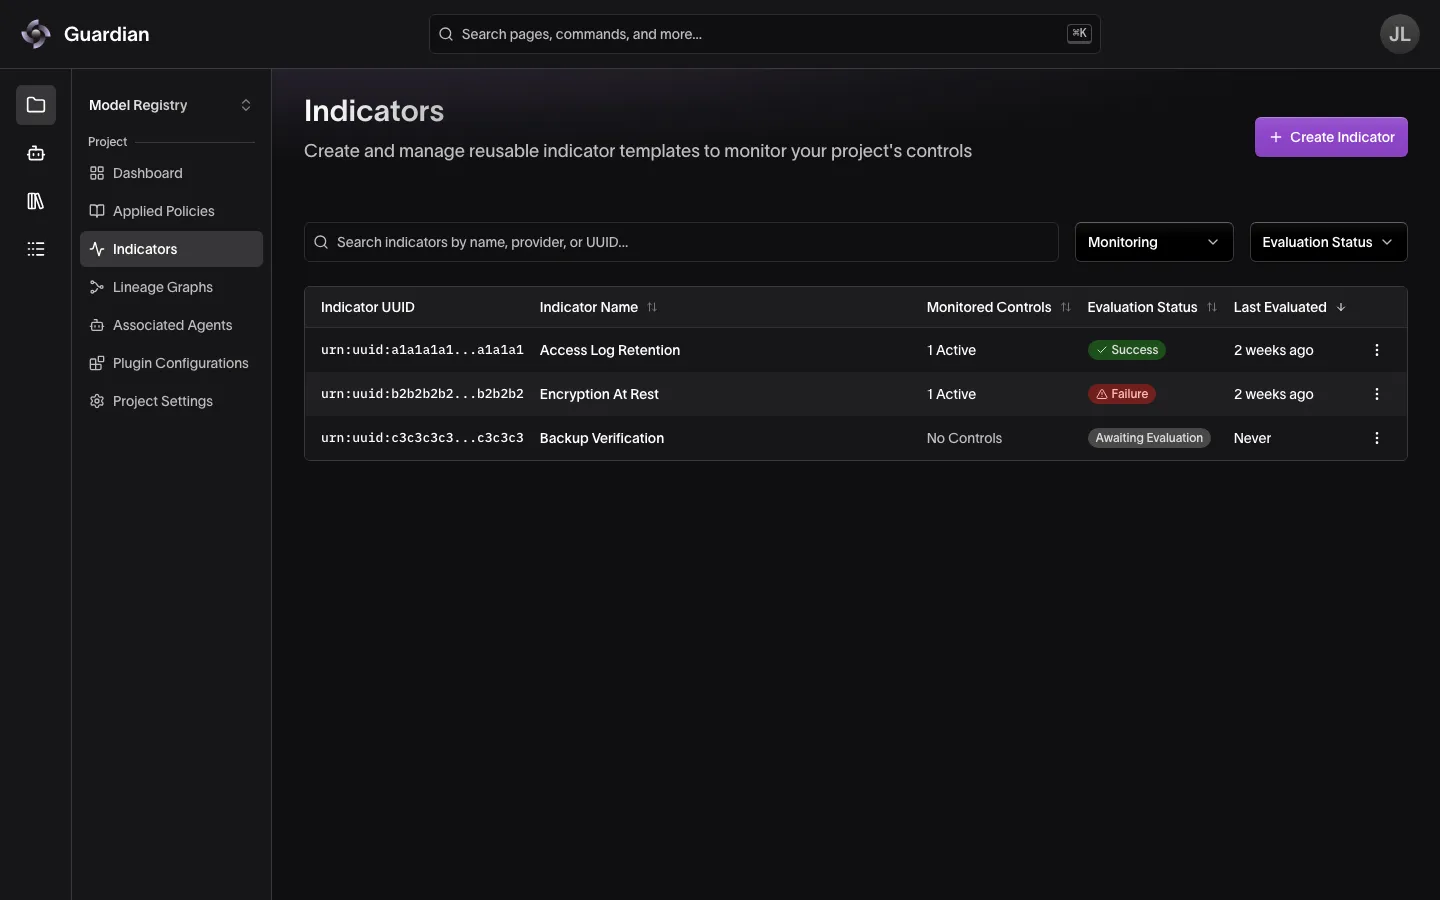
An indicator evaluates the data your systems send to it. Each time an event arrives, the indicator evaluates its contents. If the contents match the success criteria you’ve defined, the indicator’s evaluation status will display Success. If not, it will display Failure.
An indicator’s evaluation status will always reflect the latest evaluation performed — in other words, if an indicator evaluation results in Success three times and then fails on the fourth, its evaluation status will be Failure. An indicator’s complete history of evaluations can always be found on the indicator’s Evaluation Logs page.
An indicator always has one of four evaluation statuses:
- Awaiting Evaluation: The indicator has not yet received an event to evaluate.
- Success: The most recent event matched the indicator’s success criteria.
- Failure: The most recent event did not match the indicator’s success criteria.
- Evaluation Error: Something went wrong while processing the evaluation. An error does not necessarily mean the event failed the criteria — it means the evaluation could not be completed.
On the project’s Indicators page, use the Monitoring and Evaluation Status filters to narrow the list.
Creating an indicator
Creating an indicator involves a few interconnected decisions, and because an indicator can’t be edited once created, those decisions are final. This guide walks through each component so you can set yours up with confidence the first time.
This guide covers:
Indicator components
An indicator is made up of three parts, each of which you define during creation:
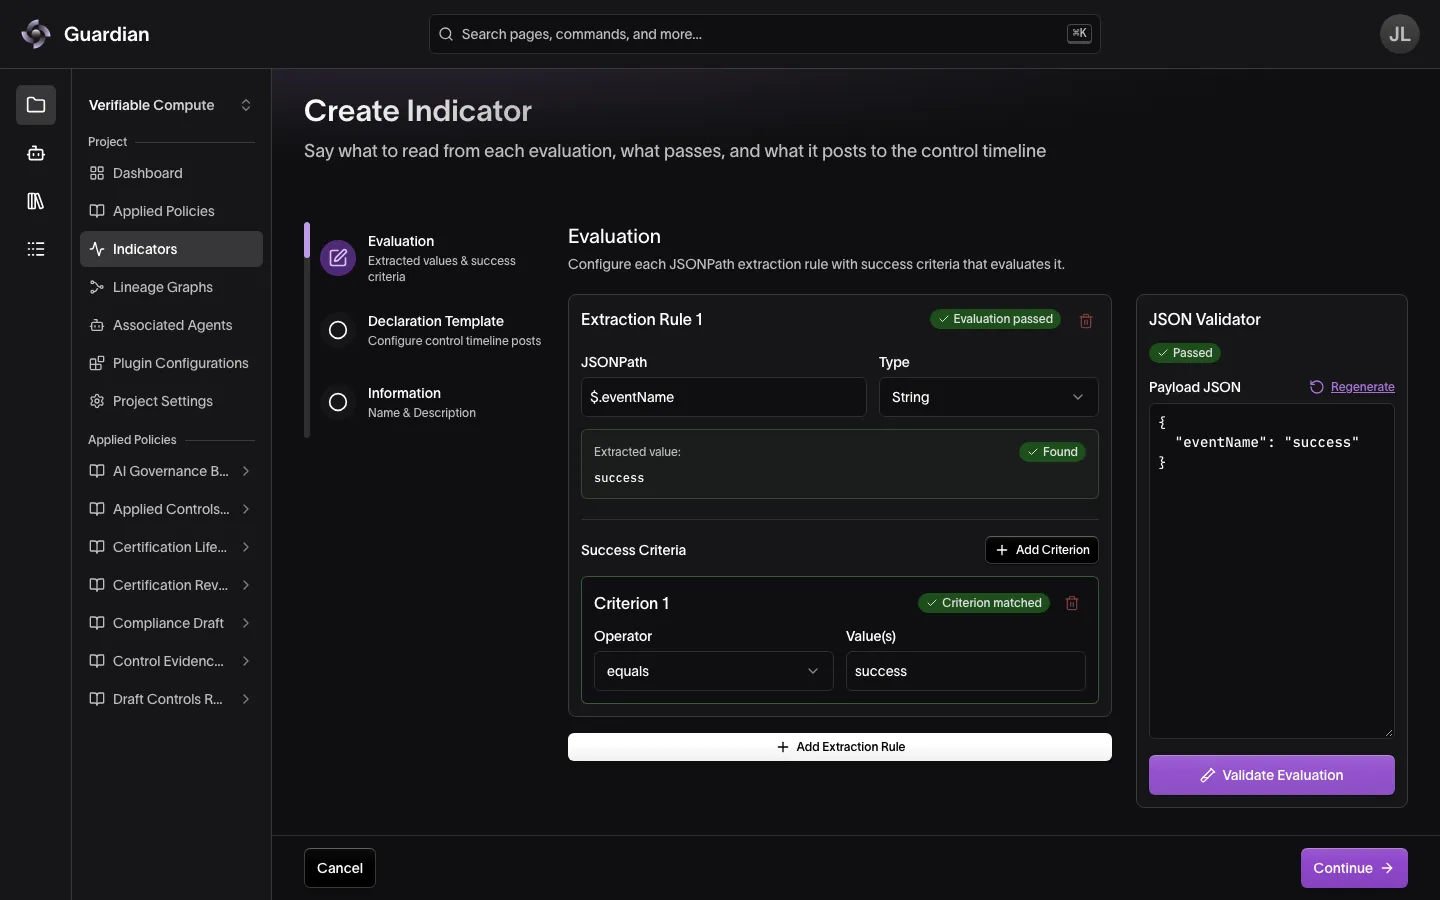
- Evaluation: Define what the indicator does with each event your systems send it. You set one or more Extraction Rules, which tell the indicator where to look in an event (using a JSONPath) and what value to expect there (using Success Criteria).
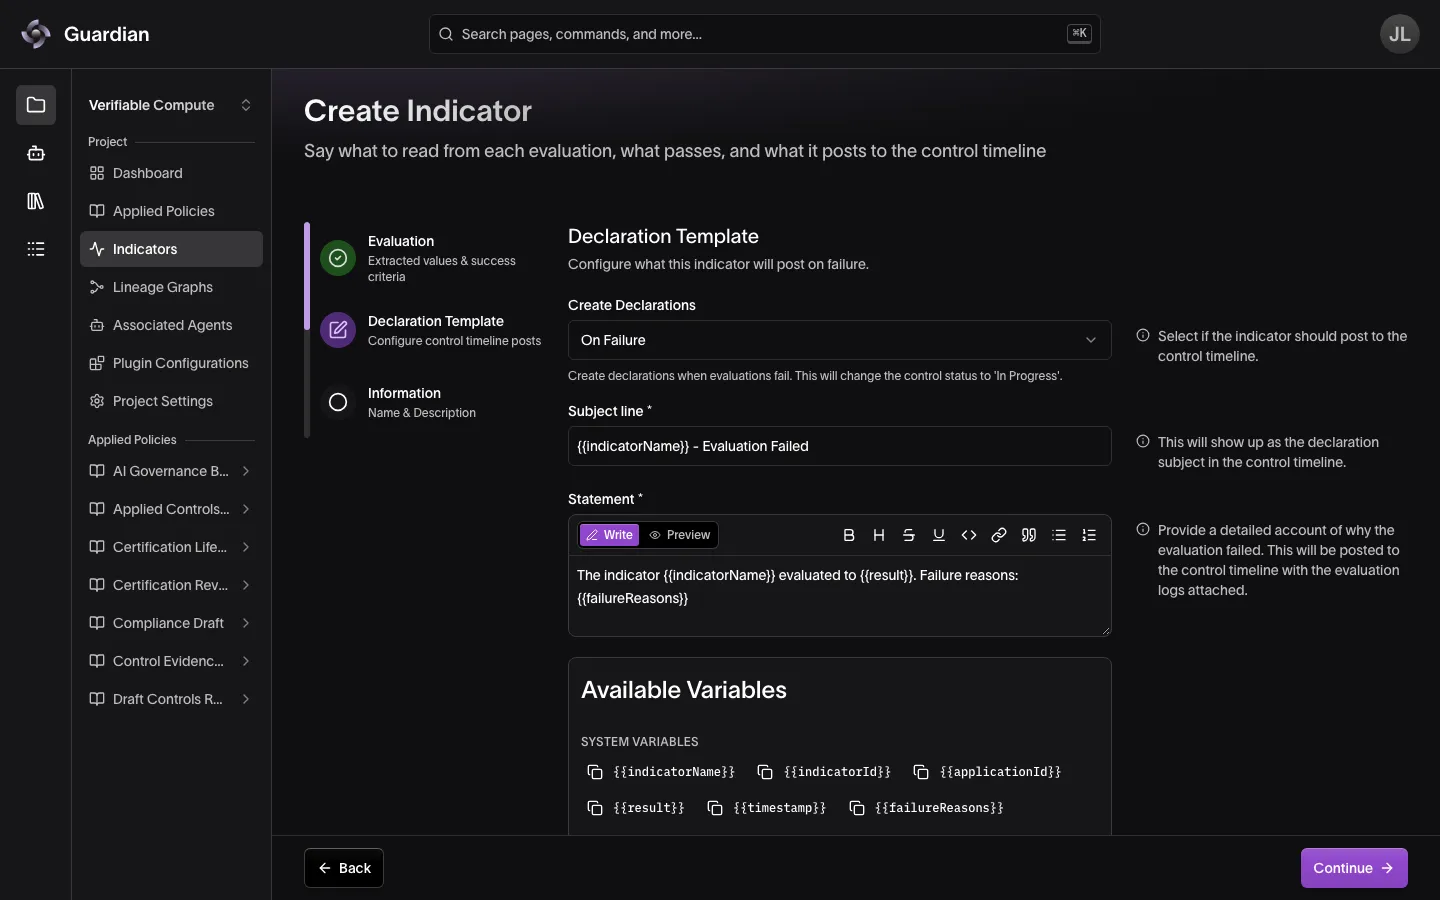
- Declaration Template: Optionally, your indicator can automatically post a declaration marked In Progress to all controls in which it is applied whenever an evaluation results in Failure. If desired, you use this template to define the declaration the indicators submits.
- Information: A Name and Description that identify the indicator and explain what it monitors.
Indicator creation prep
Before creating an indicator, it’s helpful to work backwards by understanding the controls you anticipate applying the indicator to.
- Choose a control whose requirements can be evaluated programmatically
- Define those requirements in machine-readable form, including any specific success or failure states
- Determine whether or not you want the indicator to post a declaration upon failure
Using the indicator creation flow
To navigate to the Create Indicator flow:
- In the project sidebar, select Indicators
- Select Create Indicator
Once in the Create Indicator flow, you’ll move through three steps — Evaluation, Declaration Template, and Information:
Evaluation
Configure an Extraction Rule to define how data is extracted from incoming events and how an evaluation is considered a Success.
For additional guidance on how to configure an indicator’s evaluation, see Additional evaluation guidance.
- Define how an indicator extracts data using a JSONPath.
- Enter a JSONPath expression to extract a value from incoming events (for example,
$.eventName). - Select the Type of the extracted value (for example, String).
- Enter a JSONPath expression to extract a value from incoming events (for example,
- Define how an indicator results in Success using Success Criteria.
- Select an Operator (for example, equals).
- Enter the target Value(s) (for example, success).
- Optionally, select Add Criterion to add another condition. An event passes only if it meets every criterion.
- Optionally, select Add Extraction Rule to add another rule. If doing so, repeat steps 1 and 2.
- Validate your configuration using the JSON Validator. Continue stays disabled until the validation passes.
- Enter a sample event in Payload JSON, or select Regenerate to generate one from your rules.
- Select Validate Evaluation.
Declaration Template
Configure whether the indicator submits a declaration to the controls it’s applied to, and what that declaration says.
- Under Create Declarations, choose when the indicator posts a declaration:
- On Failure: The indicator posts a declaration marked In Progress each time an evaluation results in Failure; this automatically updates each control’s status to In Progress.
- Never: The indicator posts no declarations. Its results are still recorded in the Evaluation Logs, and control statuses are not affected.
- If you selected On Failure, define the declaration:
- Enter a Subject line.
- Enter a Statement describing what happened. Use the Available Variables to insert values from the evaluation — such as
{{indicatorName}},{{result}}, and{{failureReasons}}— that are filled in automatically when the declaration is posted.
- Select Preview to see how the declaration will appear on the control timeline.
Information
Give the indicator a name and description so it can be easily identified.
- Enter a Name for the indicator.
- Optionally, enter a Description explaining what the indicator monitors.
- Select Create Indicator.
Applying an indicator to controls
Once created, an indicator can be applied to one or multiple controls belonging to any applied policy in its project.
Applying an indicator to a control activates it for that control — meaning the indicator will evaluate events your systems send and, if configured, post declarations to that control’s timeline.
Indicators can be applied from the indicator’s page, from its row in the project’s Indicators list, or from an applied policy’s Monitoring page. Use the indicator’s page when applying an indicator for the first time.
To apply an indicator to a control from the indicator’s page:
- In the project sidebar, select Indicators
- Select the indicator you wish to apply
- Select Apply to Control. In the Indicators list, you can instead select Apply to Control from the indicator’s actions menu (⋮)
- Select the policy and controls you wish to apply the indicator to
- Select Apply, or Apply to N Controls when you selected more than one
To apply an indicator to a control from an applied policy’s Monitoring page:
- In the applied policy’s sidebar, select Monitoring
- Expand a control in the Monitored Controls section
- Select Apply Indicator
- In Apply Indicators to Control, select one or more indicators
- Select Apply Indicator, or Apply N Indicators when you selected more than one
Activating and disabling indicators
An applied indicator’s monitoring status can either be Active or Disabled.
- Active: This applied indicator will evaluate and log incoming events, as well as submit declarations if applicable.
- Disabled: This applied indicator will not evaluate nor log incoming events. Declarations will not be submitted.
Importantly, an indicator’s monitoring status is managed per control. In other words, you can choose for the same indicator to be Active on one control but Disabled on another. When you apply an indicator to a control, it is active by default and can evaluate incoming events immediately.
While an indicator is disabled, it remains applied to the control and retains its evaluation history.
Indicators can be activated or disabled on a control in two ways: from the indicator’s page, or from an applied policy’s Monitoring page.
To activate or disable an indicator on a control from the indicator’s page:
- In the project sidebar, select Indicators
- Select the indicator you wish to activate or disable
- In the indicator’s sidebar, select Monitored Controls
- Locate the control you wish to update, and select the actions menu (⋮) in its row
- Select Activate or Disable
To activate or disable an indicator for a control from an applied policy’s Monitoring page:
- In the applied policy’s sidebar, select Monitoring
- Expand a control in the Monitored Controls section
- Select the actions menu (⋮) for the indicator you wish to activate or disable
- Select Activate or Disable
Sending events to an indicator
Your systems send events to the Governance Service at your platform host followed by /governanceService. The call needs the Run Indicators permission on the project, and it accepts your sign-in token or an API key. The indicator’s overview page shows a Sample cURL Command with your project and indicator IDs filled in:
curl -X POST "https://guardian.example.com/governanceService/api/v2/events/ingest" \
  -H "Authorization: Bearer $GUARDIAN_API_KEY" \
  -H "Content-Type: application/json" \
  --data '{
    "eventType": "indicator",
    "source": "custom-indicator",
    "projectId": "<project UUID>",
    "indicatorId": "<indicator UUID>",
    "payload": { "status": "active" },
    "timestamp": "2026-10-16T09:30:00Z"
  }'
All six fields are required, eventType is always indicator, and unknown fields are rejected with a 400. Your extraction rules read payload. The event is evaluated by every active application of the indicator in the project:
{
  "eventId": "6f1c2b7e-…",
  "status": "processed",
  "evaluationsCreated": 1,
  "declarationsCreated": null
}
declarationsCreated lists the IDs of any declarations the evaluation posted. A status of no_route means the indicator is not active on any control.
Viewing indicator evaluation logs
Every time an indicator evaluates an event, the result is recorded as an entry in the Evaluation Logs. Each entry shows the indicator, the applied policy and control, the evaluation status, and when the event was received. Selecting an entry opens its full detail, including the evaluation criteria and the value that was extracted.
There are three ways to view evaluation logs, depending on the scope you want:
All evaluations in a project
- In the project sidebar, select Dashboard, and locate the Latest Evaluations widget
- Select See All
This opens the project’s Evaluation Logs, showing every indicator evaluation across the project by default.
Evaluations for a specific applied policy
- In the applied policy’s sidebar, select Evaluation Logs
This opens the applied policy’s Evaluation Logs page, showing only that policy’s evaluations. You can also reach it from the policy’s Monitoring page: in the Latest Evaluations widget, select See All.
Evaluations for a specific indicator
- In the project sidebar, select Indicators
- Select an indicator
- In the indicator’s sidebar, select Evaluation Logs
This shows evaluations for that indicator only, across every control it’s applied to.
On any Evaluation Logs page, select Export to download the evaluations that match your search and filters as JSONL or CSV.
Additional evaluation guidance
This section is a reference for configuring an indicator’s evaluation — how to locate a value in an event with JSONPath, the data types and operators available, and example configurations that combine them.
Writing JSONPath expressions
Indicators use JSONPath to select values from incoming event data. Use the simplest path possible — simple paths are easier to validate and easier for auditors to understand.
Supported patterns
| Pattern | Example | Use |
|---|---|---|
| Root field | $.status | Read a top-level field. |
| Nested field | $.deployment.region | Read a field inside an object. |
| Array item | $.checks[0].result | Read a value from a known array position. |
| Wildcard | $.checks[*].result | Read the same field from every array item. |
| Quoted key | $.labels['team-name'] | Read a key that contains spaces, hyphens, or dots. |
Array positions are zero-based, and only whole, non-negative index numbers are supported.
Recommended style
- Prefer direct field paths.
- Use a wildcard when every array item should be considered.
- Reference array items by a stable position. If an array’s order can change, use a wildcard instead of a fixed index.
- Test paths with realistic event samples before relying on them in a control workflow. The JSON Validator flags invalid syntax as you build.
Not supported
Indicator evaluation supports only the patterns above. The following are rejected and should not be used:
- Recursive descent, such as
$..result. - Filter expressions, such as
$.checks[?(@.name == 'scan')]. - Regular-expression matches.
- Negative array indices, such as
$.checks[-1].
Indicator evaluation is intended for predictable event fields, not complex transformations.
Data types
When configuring a criterion, choose the data type that matches the value you’re evaluating. The operators available depend on the type you select.
| Data type | Definition |
|---|---|
| Boolean | A true or false value, used to check states like enabled or disabled. |
| String | A text value such as a name, status, or category. |
| Number | A numeric value (integer or decimal), used for quantities, counts, or thresholds. |
| List of Strings | A collection of text values, checked against an allowed set. |
| List of Numbers | A collection of numeric values, checked against an allowed set. |
| Date | A timestamp in RFC 3339 format, used to check dates and times. |
Operators
An operator defines how the extracted value is compared against your target value. Only the operators available for your selected data type will appear.
| Operator | Definition | Available for |
|---|---|---|
| equals | Checks if the extracted value exactly matches your target value. | String, Number, Boolean, Date |
| not equals | Checks if the extracted value does not match your target value. | String, Number, Boolean, Date |
| in | Checks that every value in the extracted list is one of the values in your target list. | String, Number, List of Strings, List of Numbers |
| not in | Checks that none of the values in the extracted list appear in your target list. | String, Number, List of Strings, List of Numbers |
| contains | Checks if the extracted text includes your target text. | String |
| not contains | Checks if the extracted text does not include your target text. | String |
| greater than | Checks if the extracted value is strictly greater than your target value. | Number, Date |
| less than | Checks if the extracted value is strictly less than your target value. | Number, Date |
| greater than or equal | Checks if the extracted value is greater than or equal to your target value. | Number, Date |
| less than or equal | Checks if the extracted value is less than or equal to your target value. | Number, Date |
Example configurations
| Example | Type | Operator | Successful value in event |
|---|---|---|---|
| Confirm only authorized teams have folder access | List of Strings | in | ["finance", "legal"] (target: finance, legal) |
| Check if status is active | String | equals | "active" |
| Check if environment is one of an allowed set | String | in | "production" (target: production, staging, test) |
| Check if a name includes a prefix | String | contains | "prod-east" (target: prod-) |
| Monitor CPU usage | Number | greater than or equal | 80 |
| Verify a flag is true | Boolean | equals | true |
| Confirm every reported status is allowed | List of Strings | in | ["active", "pending"] (target: active, pending) |
| Ensure last run occurred before a date | Date | less than | 2026-10-06T00:03:00Z |
Troubleshooting
Before sending production events, send one test event and confirm it appears in the indicator’s Evaluation Logs. Keep the event fields your criteria read stable, since renaming one breaks its JSONPath.
| Symptom | What to check |
|---|---|
| An event produces no evaluation | The event names the right project and indicator, and the indicator is applied to the control. |
| An applied indicator stopped evaluating | Its monitoring status on that control is Disabled. Activate it. |
| An event you expect to pass shows Failure or an error | The event’s fields do not match the JSONPath in the evaluation criteria, or its data type differs. |
Related
- Controls — the statuses an indicator’s declarations move a control into
- Declarations and Reviews — what an In Progress declaration means for a control
- Roles and Permissions — who can create, apply, activate, and run indicators
- Glossary — quick definitions of extraction rules, success criteria, and evaluation statuses
- Activity Logs — audit when indicators are created, applied, activated, and disabled