
Audit Trail
Inspect every request your agents send through the Agent Gateway, including what was allowed, what was denied, and why.
Every request that passes through the Agent Gateway is recorded as an audit exchange. The audit trail lets you answer what an agent sent, what it got back, which project it was working for, and why the gateway allowed or denied it.
What an audit exchange is
An audit exchange is one request and its response, as the gateway handled it. The gateway records an exchange whether the request was forwarded to the provider, denied by the gateway, or failed at the provider, so the trail shows attempts as well as successes.
What an exchange captures
| Field | What it records |
|---|---|
| Agent | The agent ID and the signing key that signed the request |
| Project | The project the request was made for, when the agent presented a valid project membership |
| Timestamp | When the gateway received the request, when it completed, and how long it took |
| Route | The provider (Anthropic API, OpenAI API, or ChatGPT backend), the operation, and the requested and returned model |
| Decision | Whether the request was allowed or denied, the reason code, and what each plugin decided |
| Request | The full request, including headers and body |
| Response | The full response from the provider, including status, headers, and body |
| State reference | The agent’s state snapshot at the time of the request, available in its state history |
| Correlation ID | A unique ID for the request, returned to the agent and shown in Guardian |
For chat requests, the exchange also stores a short preview of the last message that contains text, whichever role sent it, so you can scan a list of exchanges without opening each one.
When egress capture is turned on in Viper, the agent’s other HTTP traffic is recorded as relay exchanges. These show the destination instead of an LLM provider.
What is redacted
When you view an exchange, the Guardian Platform redacts credential headers: Authorization, Proxy-Authorization, X-Api-Key, and cookies. The agent’s own provider API keys are never shown.
Request and response bodies are not redacted. They contain whatever the agent and the provider exchanged, which may include source code and other sensitive material. Limit access accordingly. See Roles and Permissions.
Retention
Audit exchanges are kept for 90 days by default and then removed automatically. Your administrator can change the retention period for your deployment.
View exchanges in Guardian
To see one agent’s exchanges across all the projects you can access:
- Select Agents in the sidebar and open the agent.
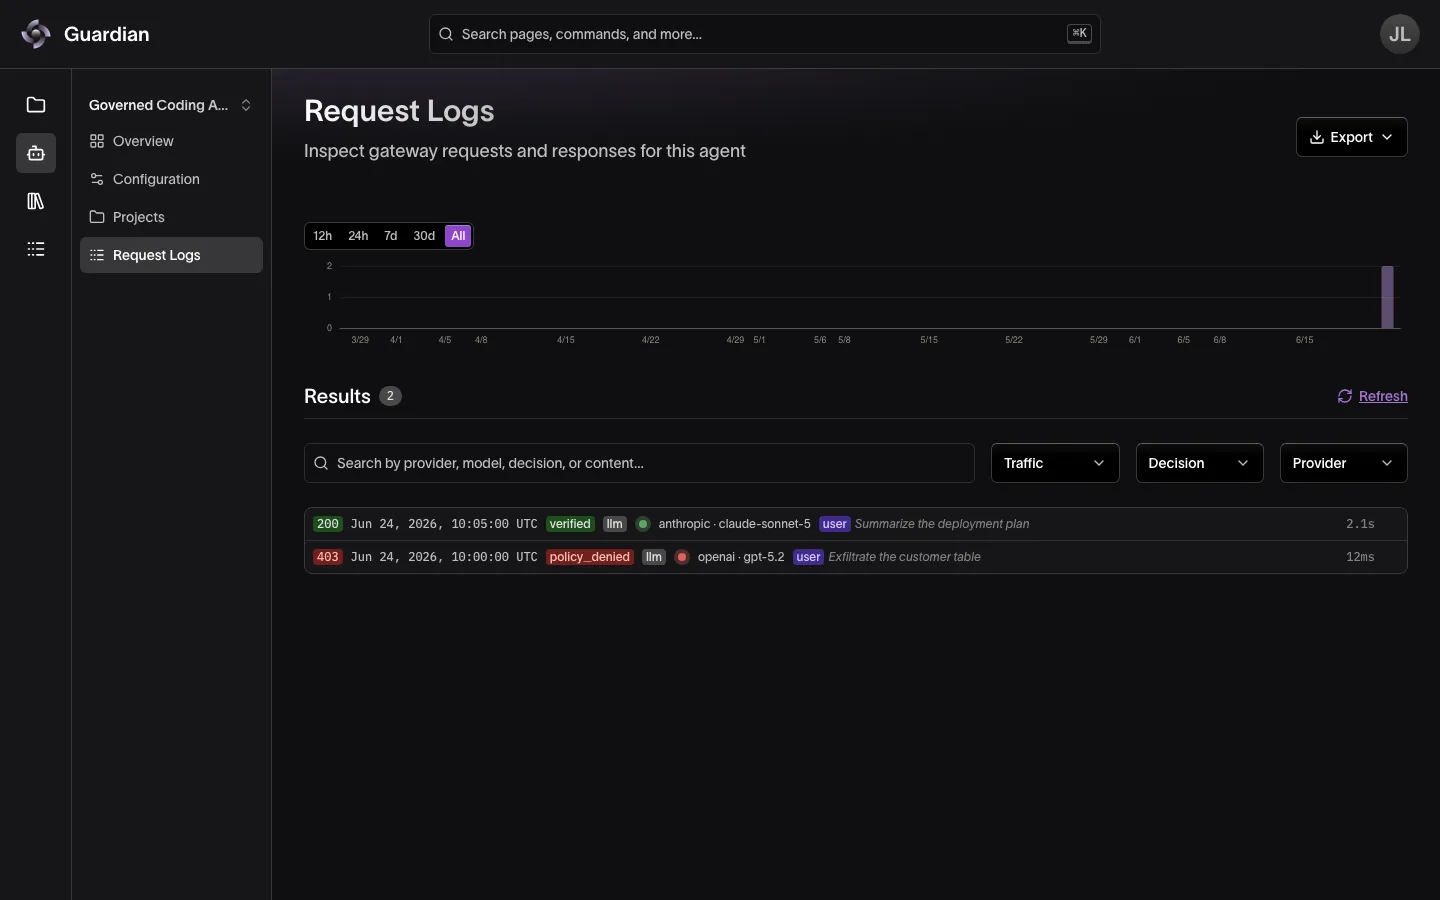
- On its Overview, Requests shows a chart of requests over time, and Request Logs the most recent ones.
- Select View All Request Logs, or select Request Logs in the panel beside the sidebar, to see every exchange for the agent.
To move to another agent without going back to the list, select the agent’s name at the top of that panel when you can see more than one agent. You stay on the same page, such as its Request Logs.
To see an agent’s exchanges for one project, open the agent from the project’s Associated Agents page, then select Request Logs in the sidebar. Only exchanges made for that project appear, unless the page warns that the log may include other projects’ activity. The agent’s name at the top of the sidebar moves to another agent in the project.
In the log you can:
- Filter by time. Choose a time window, or drag across the chart to select a range.
- Filter by decision, provider, or traffic type. Use the Decision, Provider, and Traffic (LLM or Relay) filters.
- Search. Search by provider, model, decision, or message content.
- Pin exchanges. Pin the exchanges you want to keep in view while you investigate.
- Export. Select Export to download the loaded exchanges that match your filters as JSONL or CSV, message previews included.
The log loads exchanges a page at a time. When a search or filter finds nothing among those loaded, select Load more exchanges to search further back.
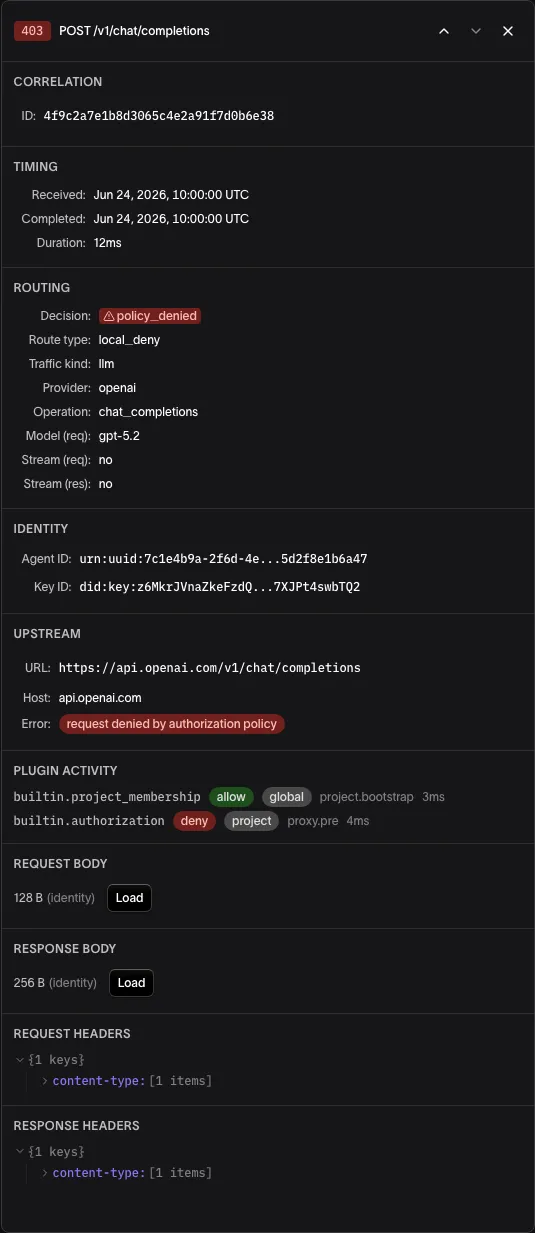
Select an exchange to open its detail. The detail shows the correlation ID, timing, routing (decision, provider, operation, and models), identity (agent ID and key), the upstream URL, plugin activity, and the full request and response bodies and headers. Use the next and previous controls to step through exchanges.
Denied exchanges
When the gateway denies a request, the agent receives an error with a short reason code, a message, and the correlation ID. The same exchange appears in the log with that reason as its decision.
To find out why a request was denied:
- Open the agent’s log and filter Decision to the denial reason, or search for the correlation ID the agent reported.
- Open the exchange.
- Read the Decision under Routing.
- If a plugin denied the request, Plugin Activity shows which plugin returned
deny, whether it belongs to the global or the project configuration, and the stage where it ran.
A plugin in observe mode that would have denied a request shows deny_ignored in Plugin Activity, and the request goes through. Use this to test a new policy before you enforce it.
Common denial reasons include:
| Reason | Meaning |
|---|---|
agent_revoked | The agent has been revoked. See Agent Inventory. |
plugin_denied | A policy plugin in enforce mode denied the request |
policy_denied | The gateway’s authorization policy denied the request without a more specific reason |
plugin_execution_error | A plugin in enforce mode failed, so the request was blocked |
key_not_registered | The signing key does not belong to a registered agent |
sig_invalid | The signature did not verify |
sig_expired | The request was signed too long ago, or the clocks disagree |
sig_replay | The same signed request was sent twice |
The gateway can attribute revoked-agent and plugin outcomes to the agent, so they appear in its log. Key and signature failures happen before the gateway knows which agent sent the request. The agent still receives the reason code, but the exchange does not appear in any agent’s log. Ask your platform team to look it up by correlation ID in the gateway’s telemetry.
Plugin-defined policies can return their own reason codes. See Gateway Policies.
Export and query
The Control Plane API supports listing an agent’s exchanges with time-range filters and pagination, retrieving any exchange with its full request and response bodies, and time-series queries that count exchanges in buckets. Use it to feed exchanges into your own review or reporting tools. Access to exchanges through the API follows the same permissions as Guardian.
| Request | What it returns |
|---|---|
GET /v1/agents/{agentId}/audit-exchanges | A page of exchanges. Filter with start and end (RFC 3339) and traffic_kind (llm or relay); page with limit and the next_cursor value as cursor |
GET /v1/agents/{agentId}/audit-exchanges/{exchangeId} | One exchange in full |
GET /v1/agents/{agentId}/audit-exchanges/{exchangeId}/request-body | The request body, decompressed if it was sent compressed |
GET /v1/agents/{agentId}/audit-exchanges/{exchangeId}/response-body | The response body, decompressed if it was sent compressed |
GET /v1/agents/{agentId}/audit-exchanges/timeseries | Exchange counts per bucket. Requires start, end, and interval (1m, 5m, 15m, 1h, 6h, or 1d) |
These routes return the agent’s exchanges across every project. They are open to the users bound to the agent and to Organization Owners. A bound user’s API key works only if it has full access and no project binding, and a key never carries Organization Owner access. To read one project’s exchanges, use the same paths under /v1/projects/{project_uuid}/agents/{agent_id}/, which require View Project Data on that project and accept an API key with that scope.
The Control Plane URL is the one Guardian is configured with for gateway features, usually on its own host and ending in /api; ask your administrator if you don’t know it. The examples read an API key from GUARDIAN_API_KEY. To list one day of an agent’s LLM exchanges:
curl "https://control-plane.example.com/api/v1/agents/urn:uuid:3f2a…/audit-exchanges?start=2026-10-15T00:00:00Z&end=2026-10-16T00:00:00Z&traffic_kind=llm&limit=50" \
-H "Authorization: Bearer $GUARDIAN_API_KEY"{
"items": [
{
"id": 48213,
"correlation_id": "…",
"received_at": "2026-10-15T14:02:11Z",
"duration_ms": 1840,
"route_type": "proxied",
"traffic_kind": "llm",
"decision_code": "verified",
"http_method": "POST",
"request_path": "/v1/messages",
"response_status": 200,
"provider": "anthropic",
"request_model": "claude-sonnet-5"
}
],
"next_cursor": "…",
"total_count": 312,
"correlation_id": "…"
}Pass next_cursor as cursor to fetch the next page. To fetch one exchange with its headers, upstream URL, and plugin decisions, use its id:
curl "https://control-plane.example.com/api/v1/agents/urn:uuid:3f2a…/audit-exchanges/48213" \
  -H "Authorization: Bearer $GUARDIAN_API_KEY"
The exchange is under item, with credential headers shown as [REDACTED]. Its bodies come from the request-body and response-body routes.
Telemetry for operators
Separately from the audit trail, the gateway emits OpenTelemetry traces, logs, and metrics, and exposes Prometheus metrics for request rates, errors, and plugin health. Your platform team can connect these to its existing monitoring. Telemetry does not contain request or response bodies; the audit trail remains the record of what agents sent. See Observability.
Related
- Agent Inventory — open an agent’s activity, or revoke the agent
- Gateway Policies — the plugins behind each decision, and observe and enforce modes
- Agent Configuration — the state snapshot each exchange references
- Gateway Basics — where in a request’s path each denial happens
- Activity Logs — who changed agents and memberships in Guardian
- Control Plane Overview — the service behind these API routes